
Quick Data Guide
What Data is Shown?
The following data is included within the GL Data Dashboard: Standard Age Score (SAS), Confidence Bands, NGRT Stanine, PASS Categories, Discrepancy Categories, Progress Categories and CAT4 Batteries.
Standard Age Score (SAS)
The Standard Age Score (SAS) is based on the number of questions a student got right; the score is adjusted for age and placed on a scale that makes a comparison with a nationally representative sample of students of the same age across the UK. The average score is 100. The SAS is key to benchmarking and tracking progress and is the fairest way to compare the performance of different students within a year group or across year groups.
Confidence bands
The Confidence Band is an indication of the range within which a student's score lies. A marker indicates the student's SAS and the range in purple indicates the 90% confidence band.
The narrower the band, the more reliable the score. Reliability values range from 0 to 1, with 0.9 being very high and 90% confidence bands showing strong reliability. This means that on 9 out of 10 occasions, the true value of the score is within the score band.
NGRT Stanine
The Stanine (ST) places the student's score on a scale of 1 (low) to 9 (high) and offers a broad overview of their performance.
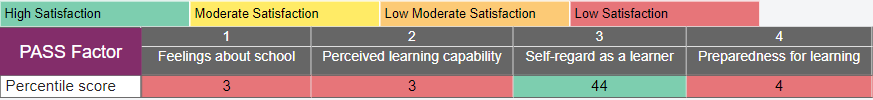
PASS Categories
There are nine PASS attitudinal factors and there are four satisfaction levels indicated in the results. They are colour coded using a traffic light system. Low Satisfaction is red, Low Moderate Satisfaction is orange, Moderate Satisfaction is yellow and High Satisfaction is green.
Discrepancy Categories
This is the difference in actual student attainment versus what their CAT4 or similar assessment result predicted.
Progress Categories
This is measured between administrations of PTM, and is expressed as much higher than expected, higher than expected, expected, lower than expected and much lower than expected.
CAT4 Batteries
CAT4 consists of four test batteries, each of which tests a different cognitive ability:
Verbal reasoning
Quantitative reasoning
Nonverbal reasoning
Spatial ability
Data Formats
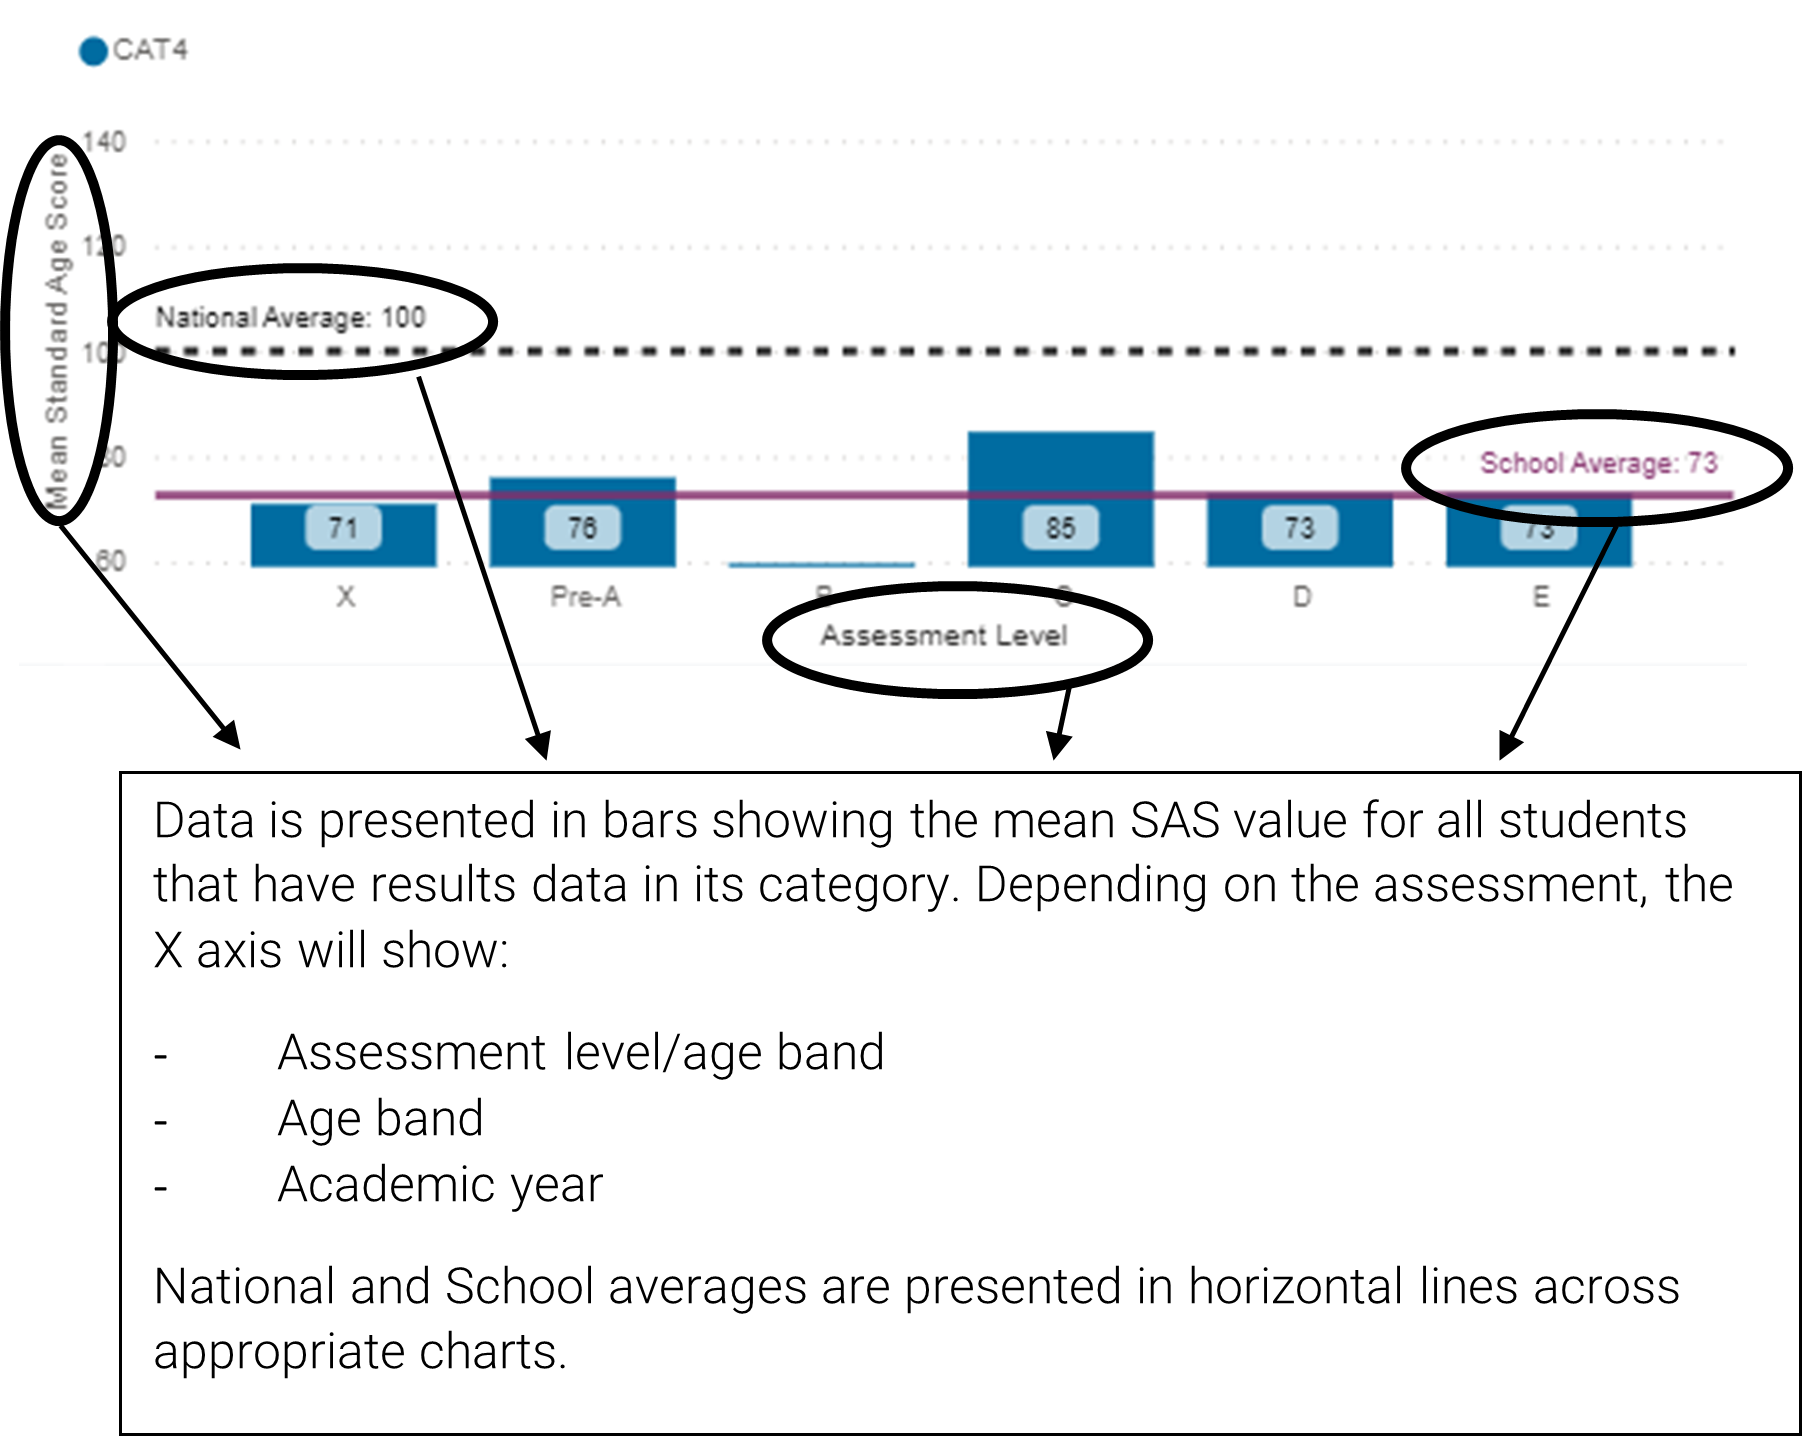
Vertical Bar Charts
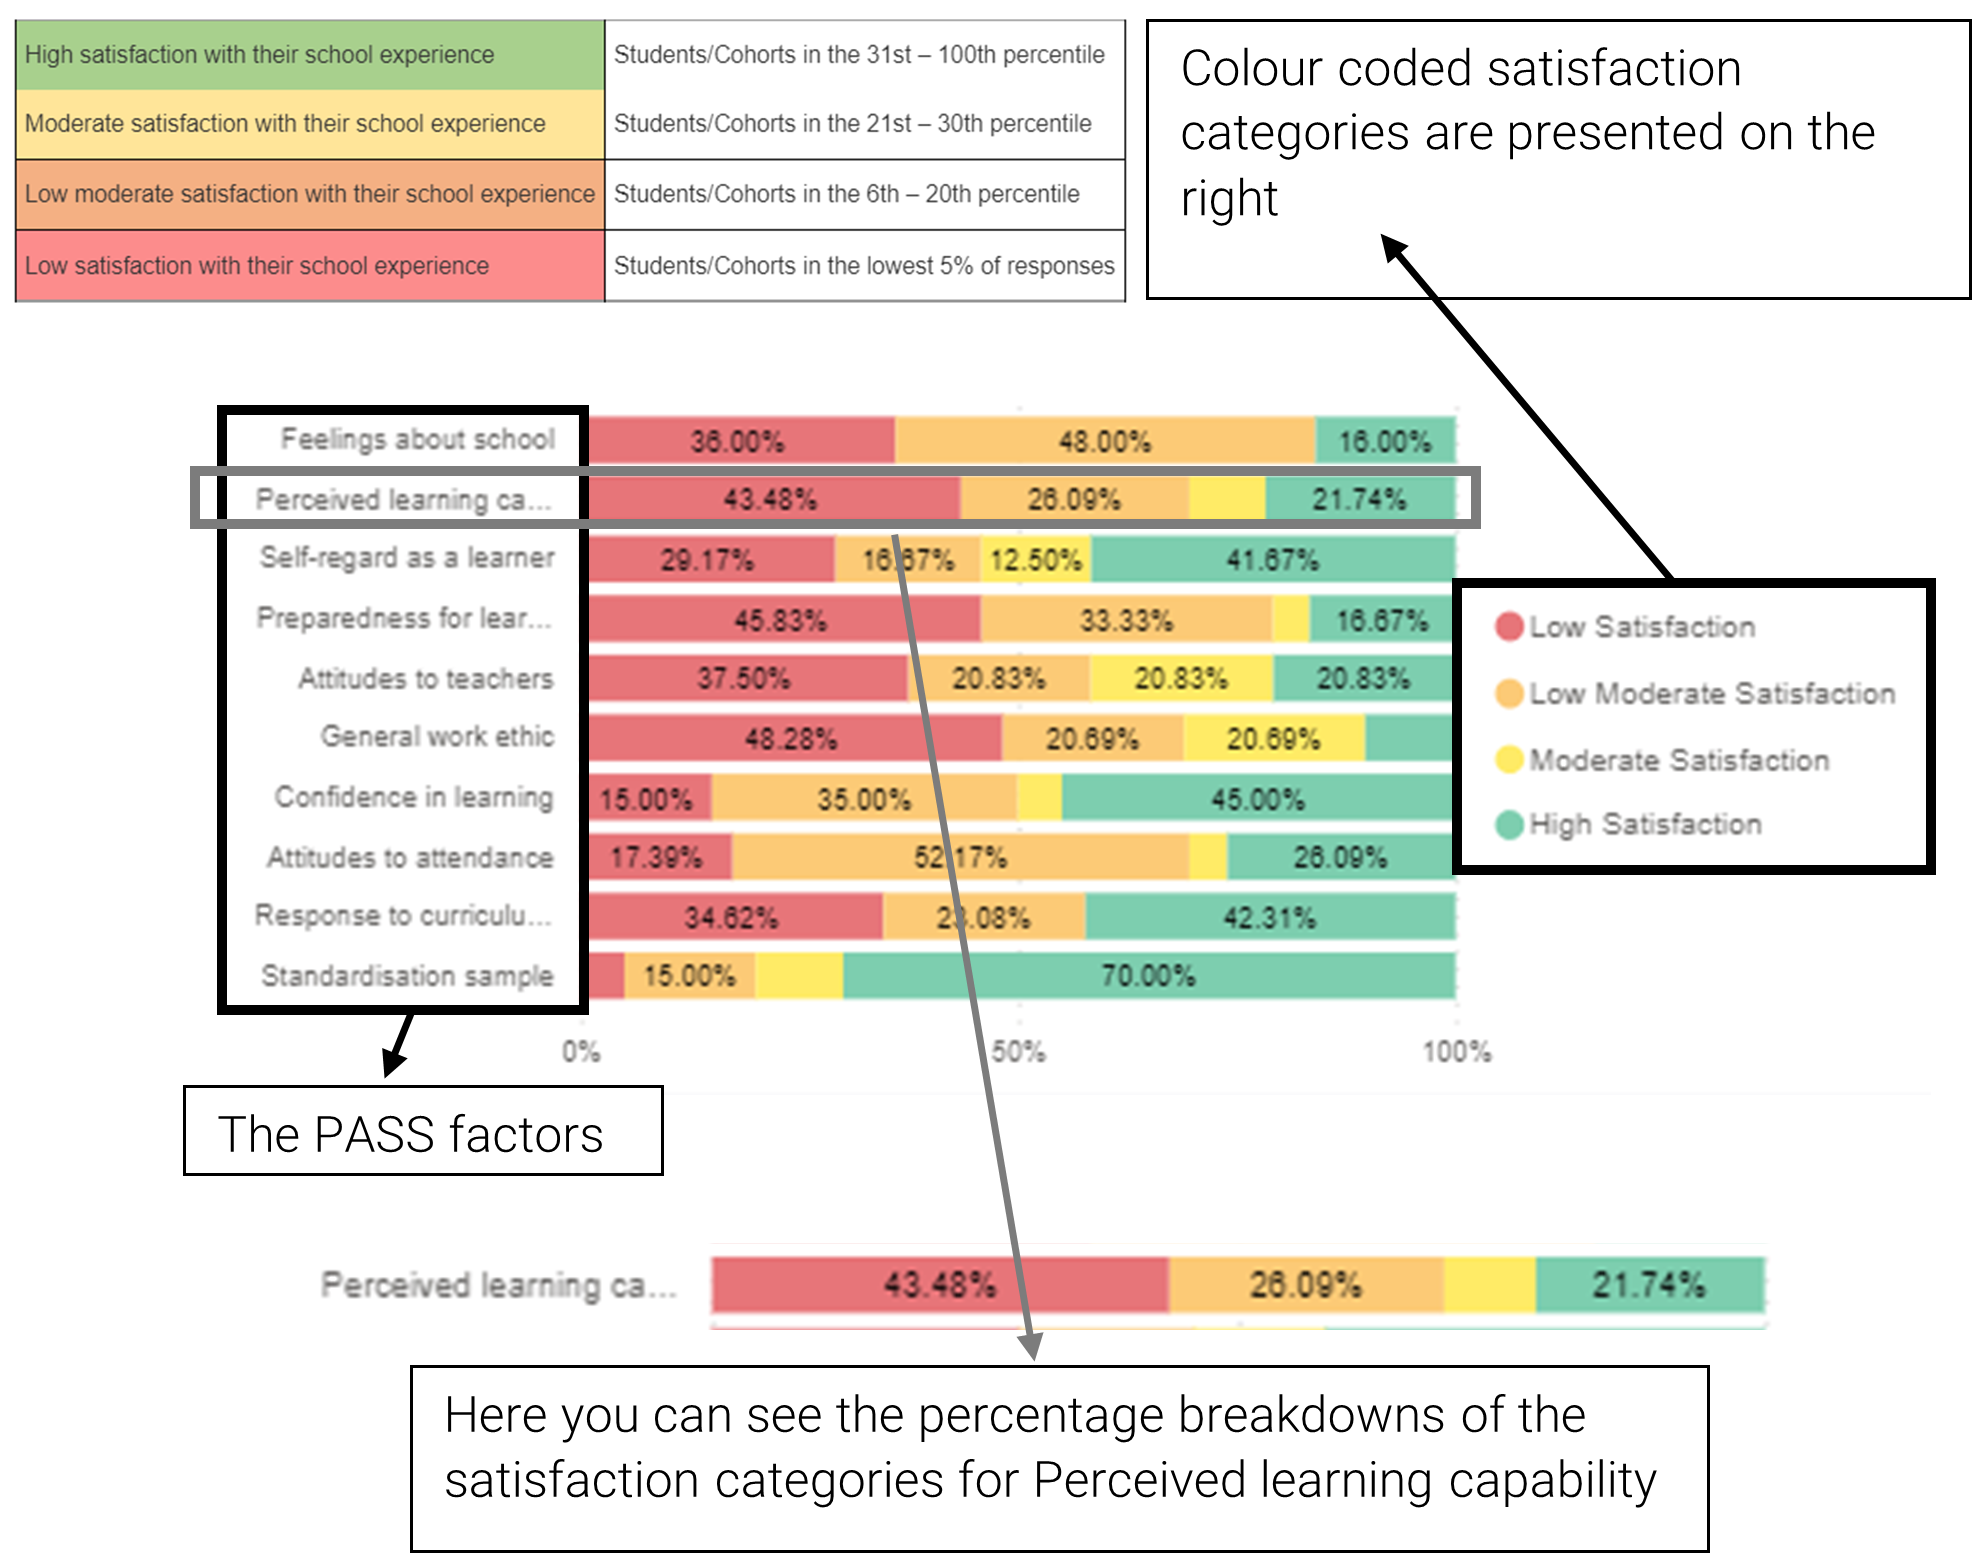
Horizontal 100% Stacked Bar Chart (PASS results only)
The PASS summary section displays a horizontal 100% stacked bar. It presents the number of students as a % per satisfaction category through the PASS factors associated with those satisfaction categories. It also displays the standardisation sample for comparison.
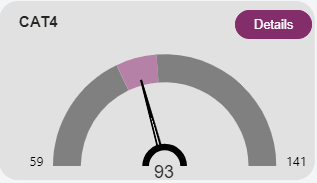
Gauges
Gauges are used to present data on WPV Product SAS. They present the student’s latest scores with confidence bands (purple shading) in the form of a tachometer. Confidence bands give an indication of the range within which a student’s score lies. The shaded area shows the average score range.
Tables
Tables summarise information in sections in the WPV for PASS, Discrepancy Categories and PT Series Progress.