

Types of scores
Types of scores
All raw scores on Exact are saved automatically to a single data file on completion of each test. The data saved also include the date and time the test was completed, as well as the registered details of the student. If a test has been abandoned before completion, then no results will be saved for that test.
The program then refers to the standardised norms in order to convert raw scores to the following three types of score:
- Standard scores (and confidence intervals)
- Percentile scores
- Age equivalents
The first of these is shown in graphical (bar graph) format as well as numerical format, while the remaining two are shown only in numerical format. These different types of score formats are explained in the following sections.
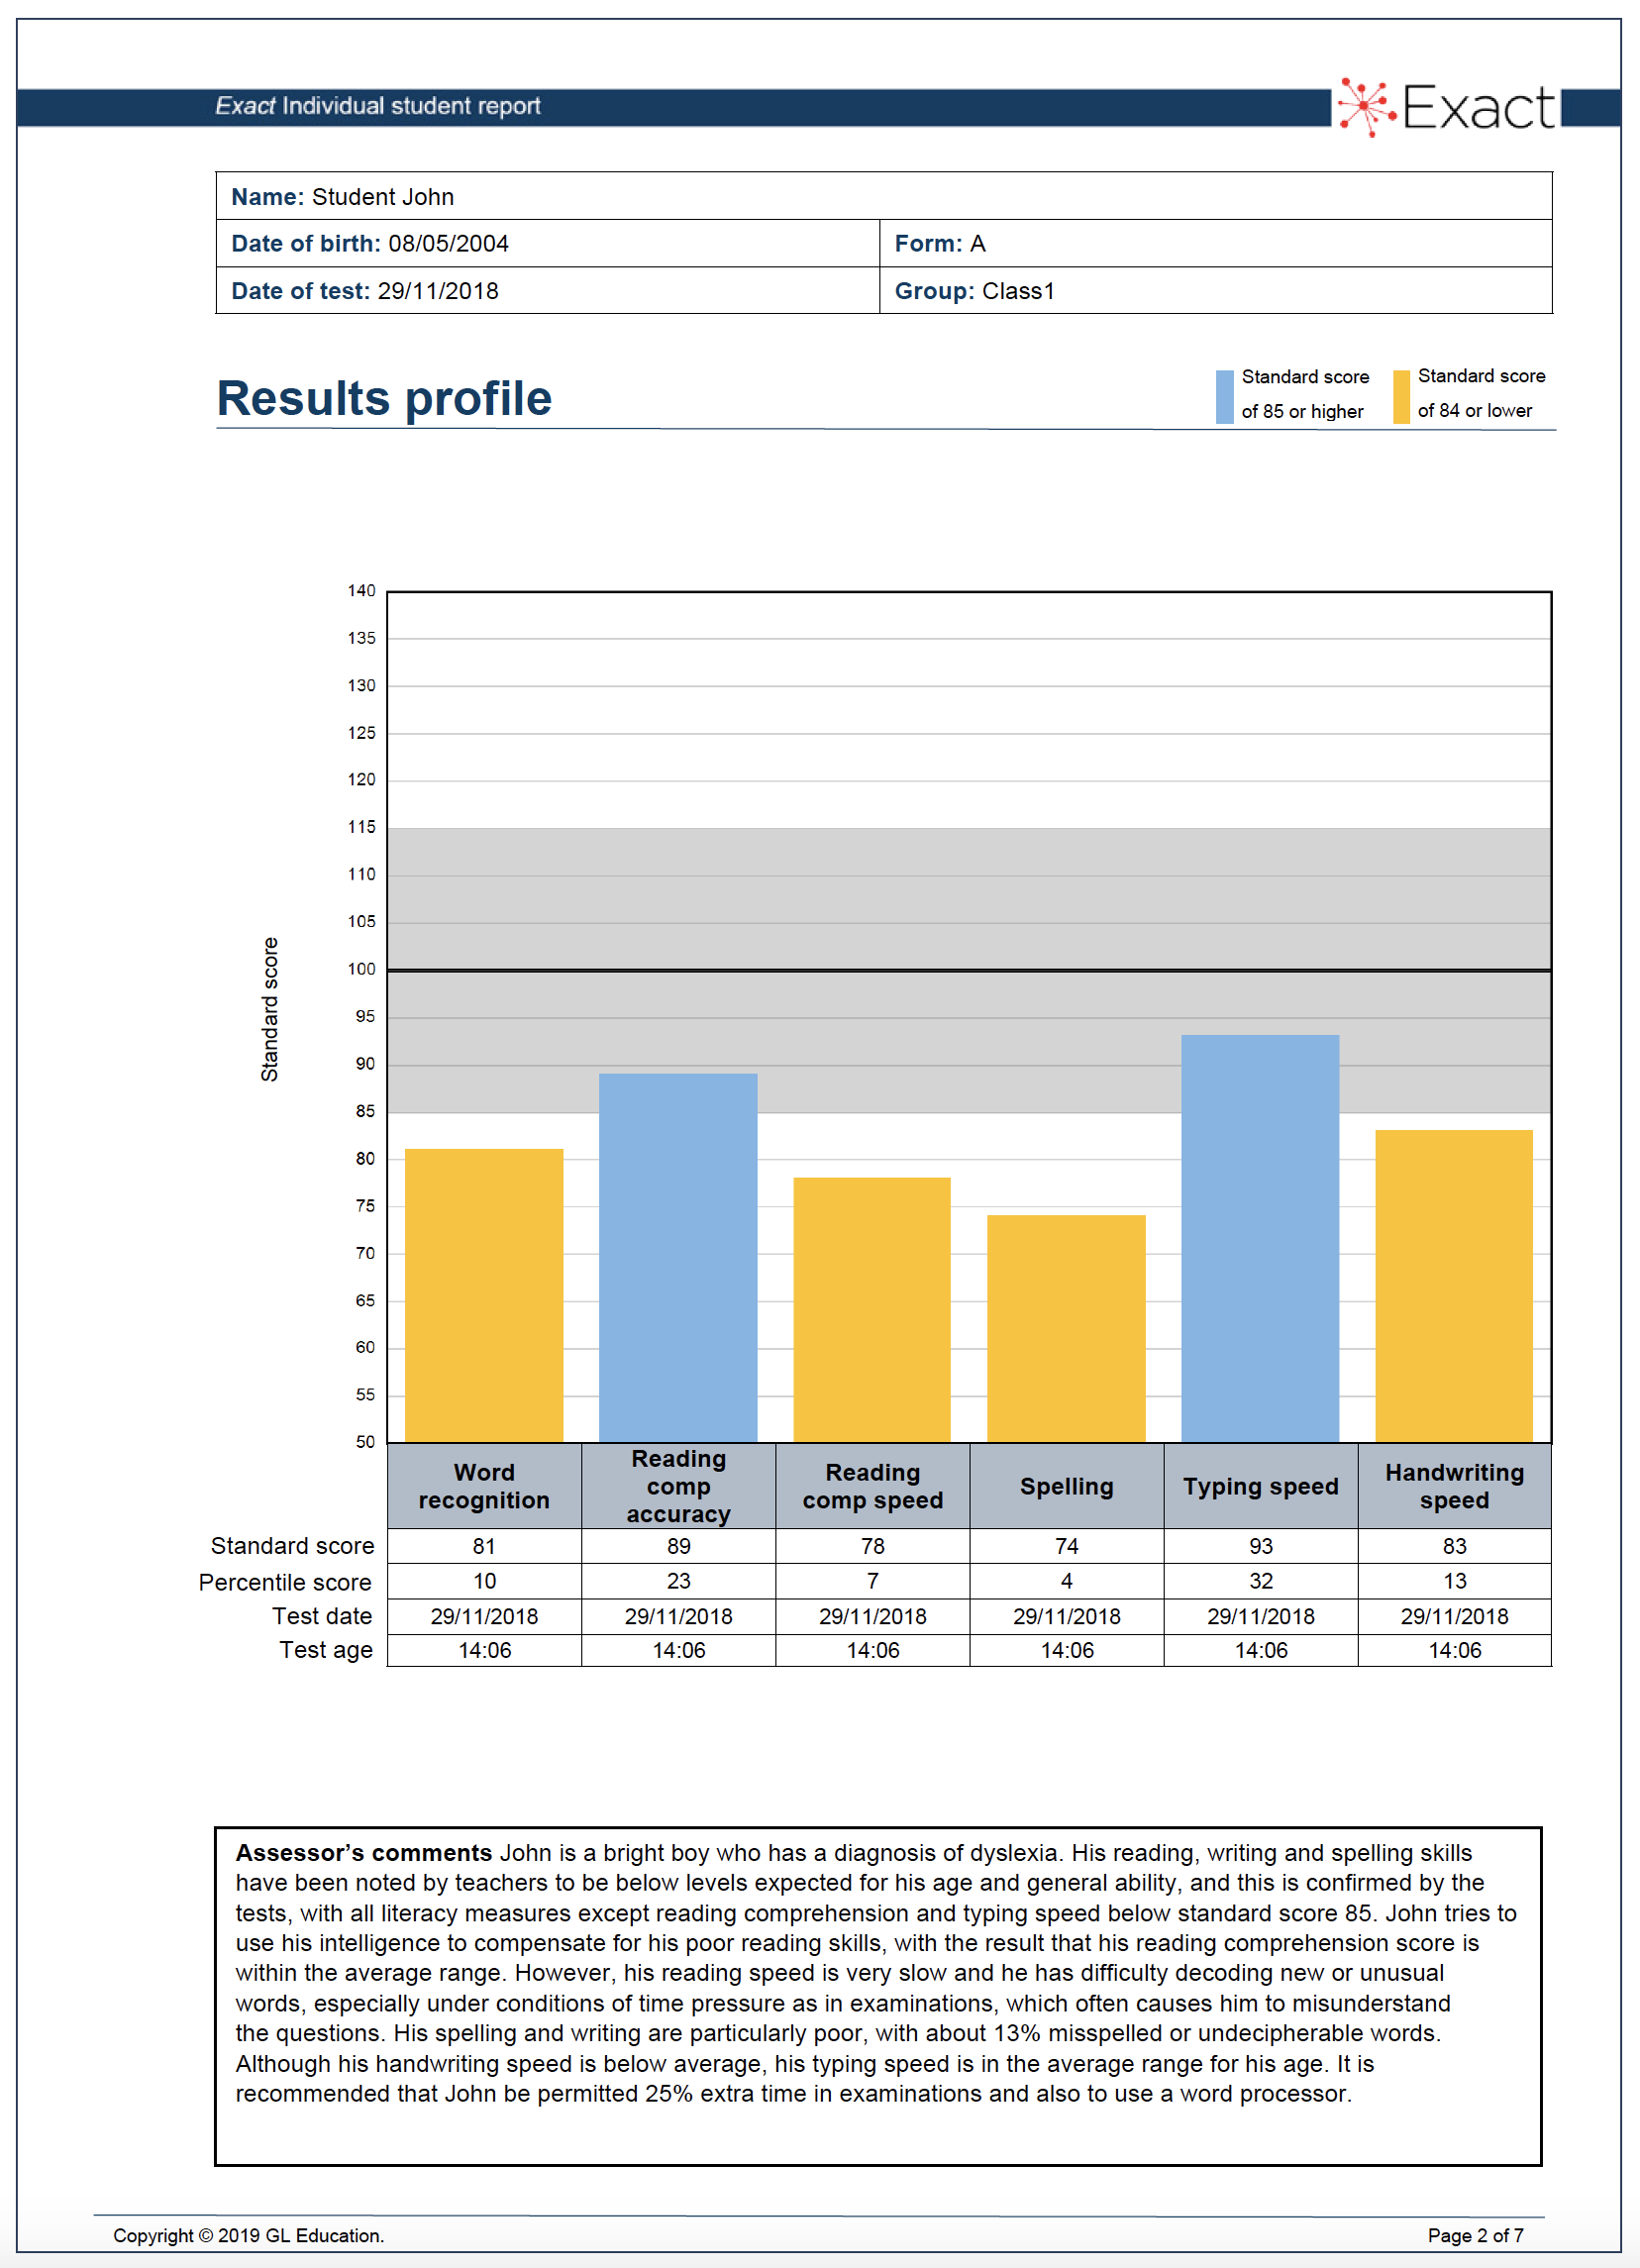
Figure 1. Example of Results profile
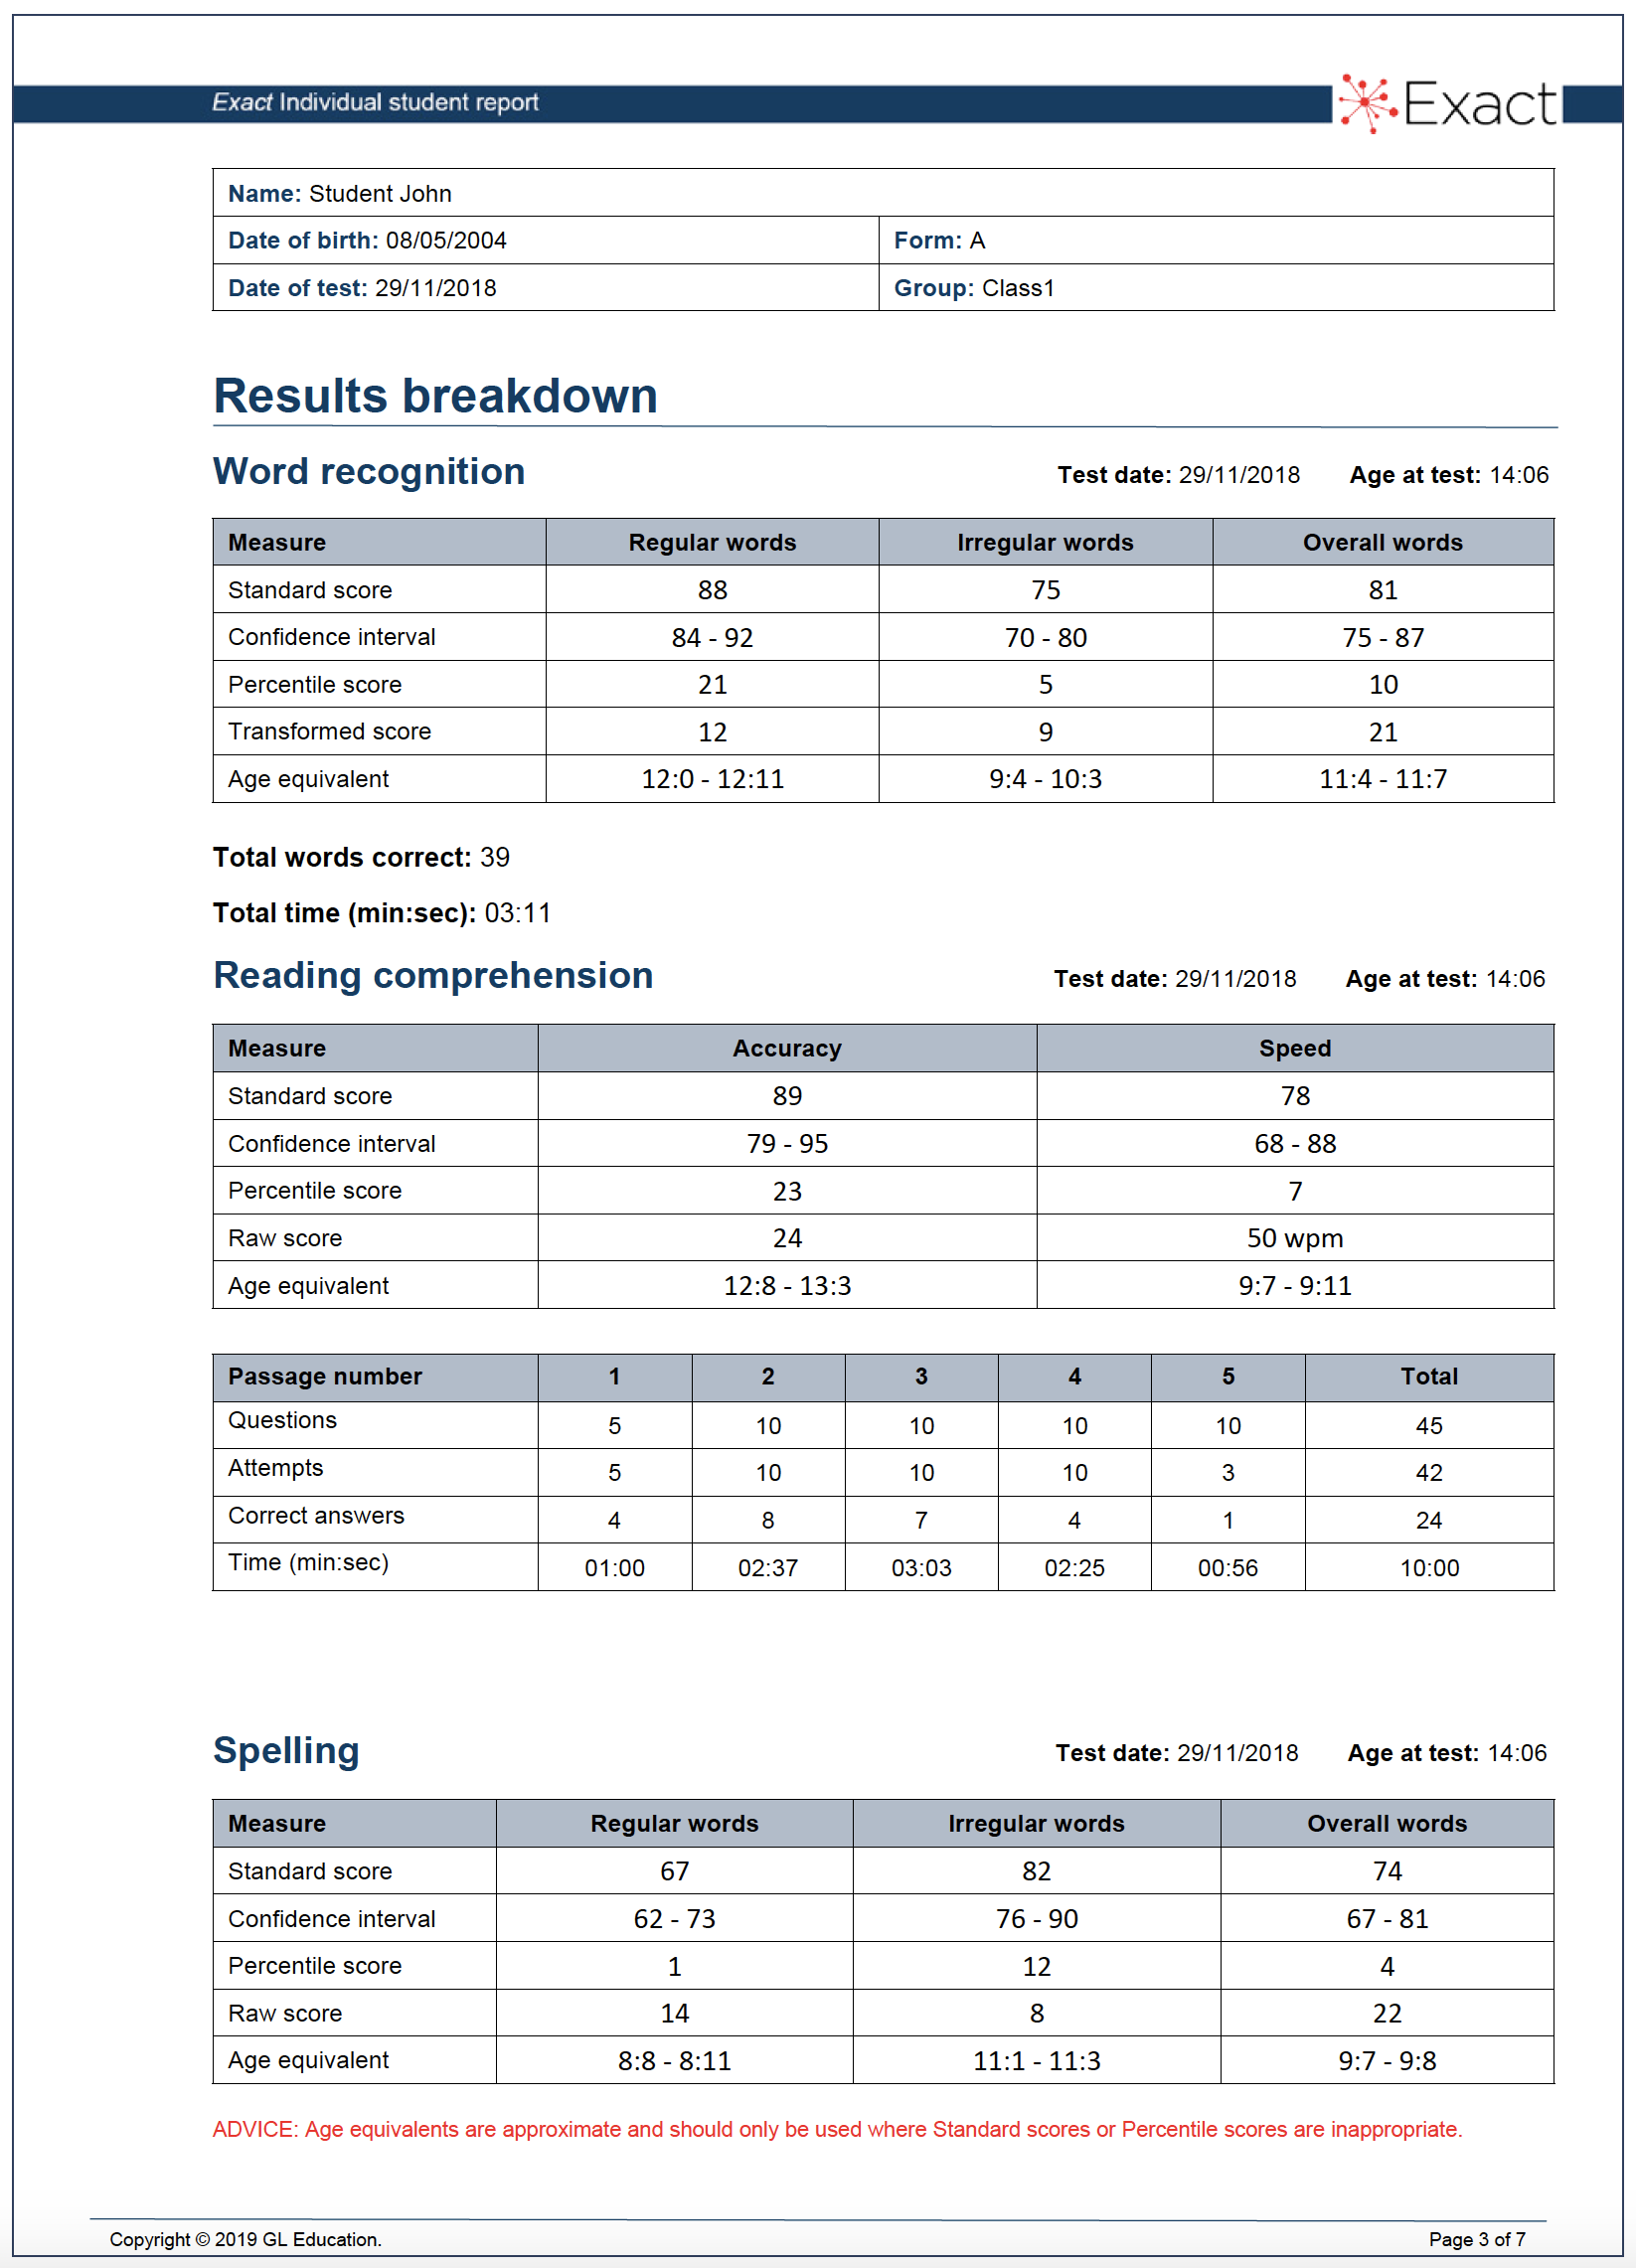
Figure 2. Example of Results breakdown
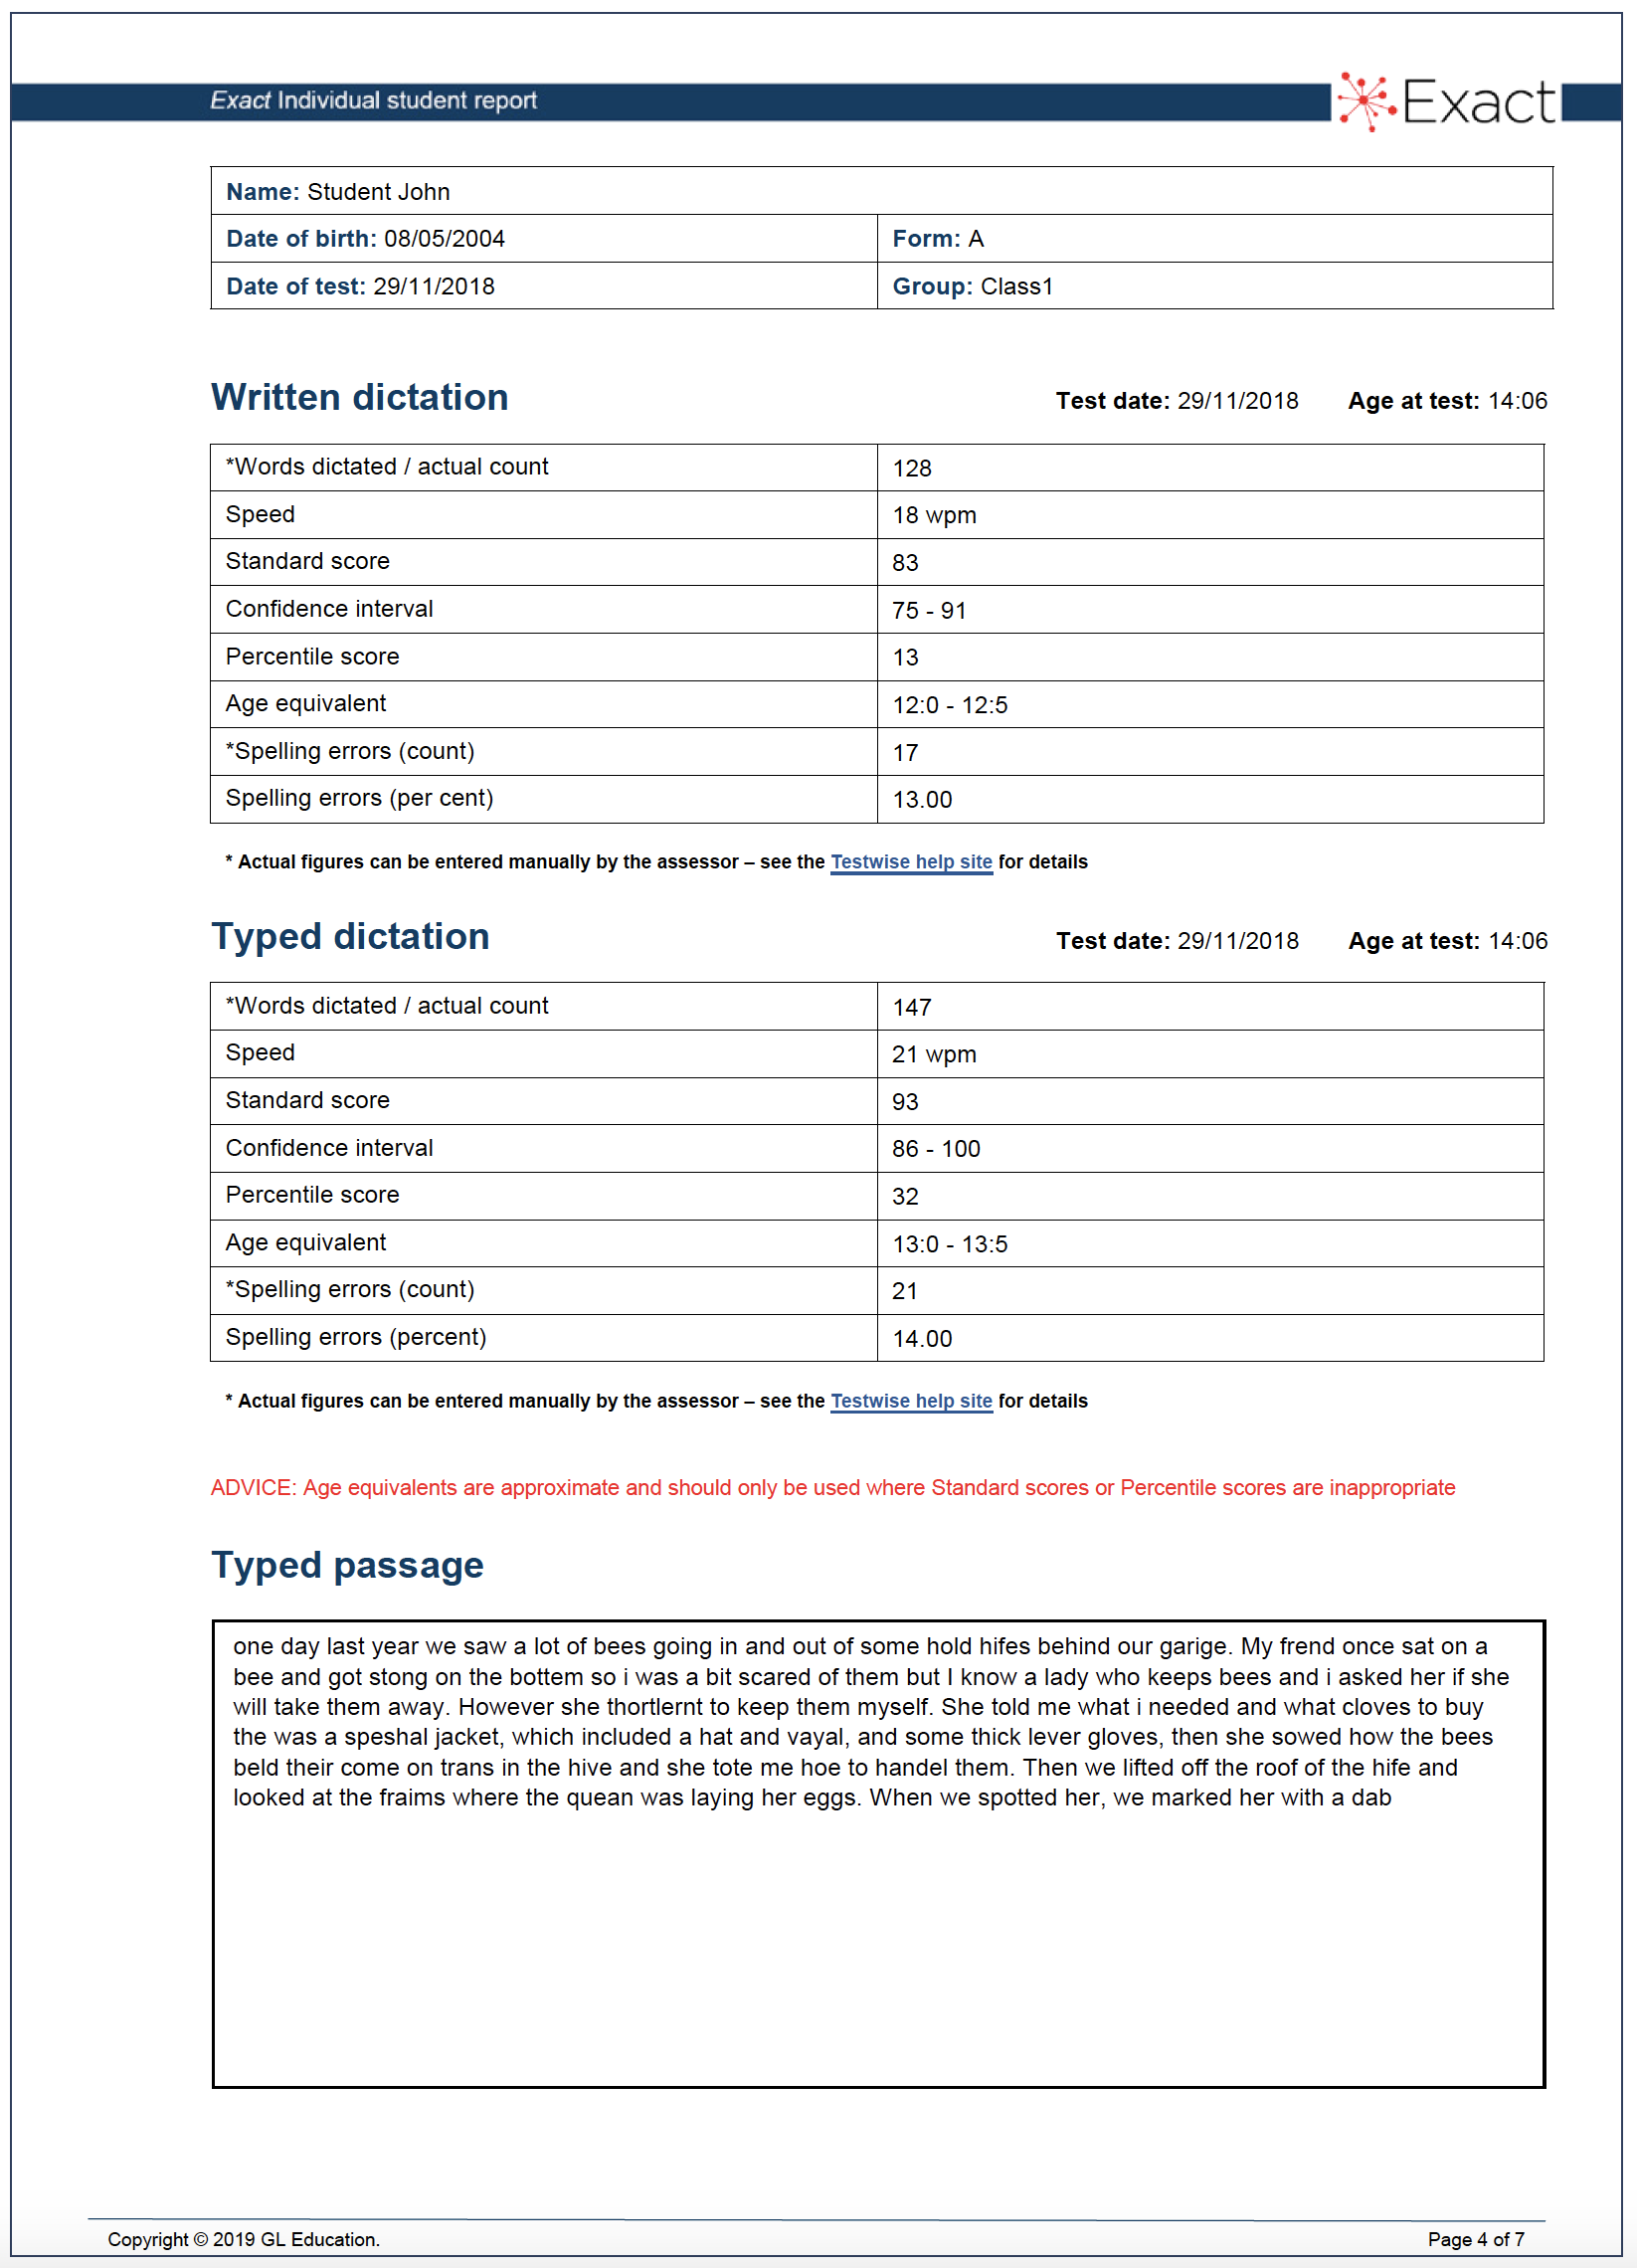
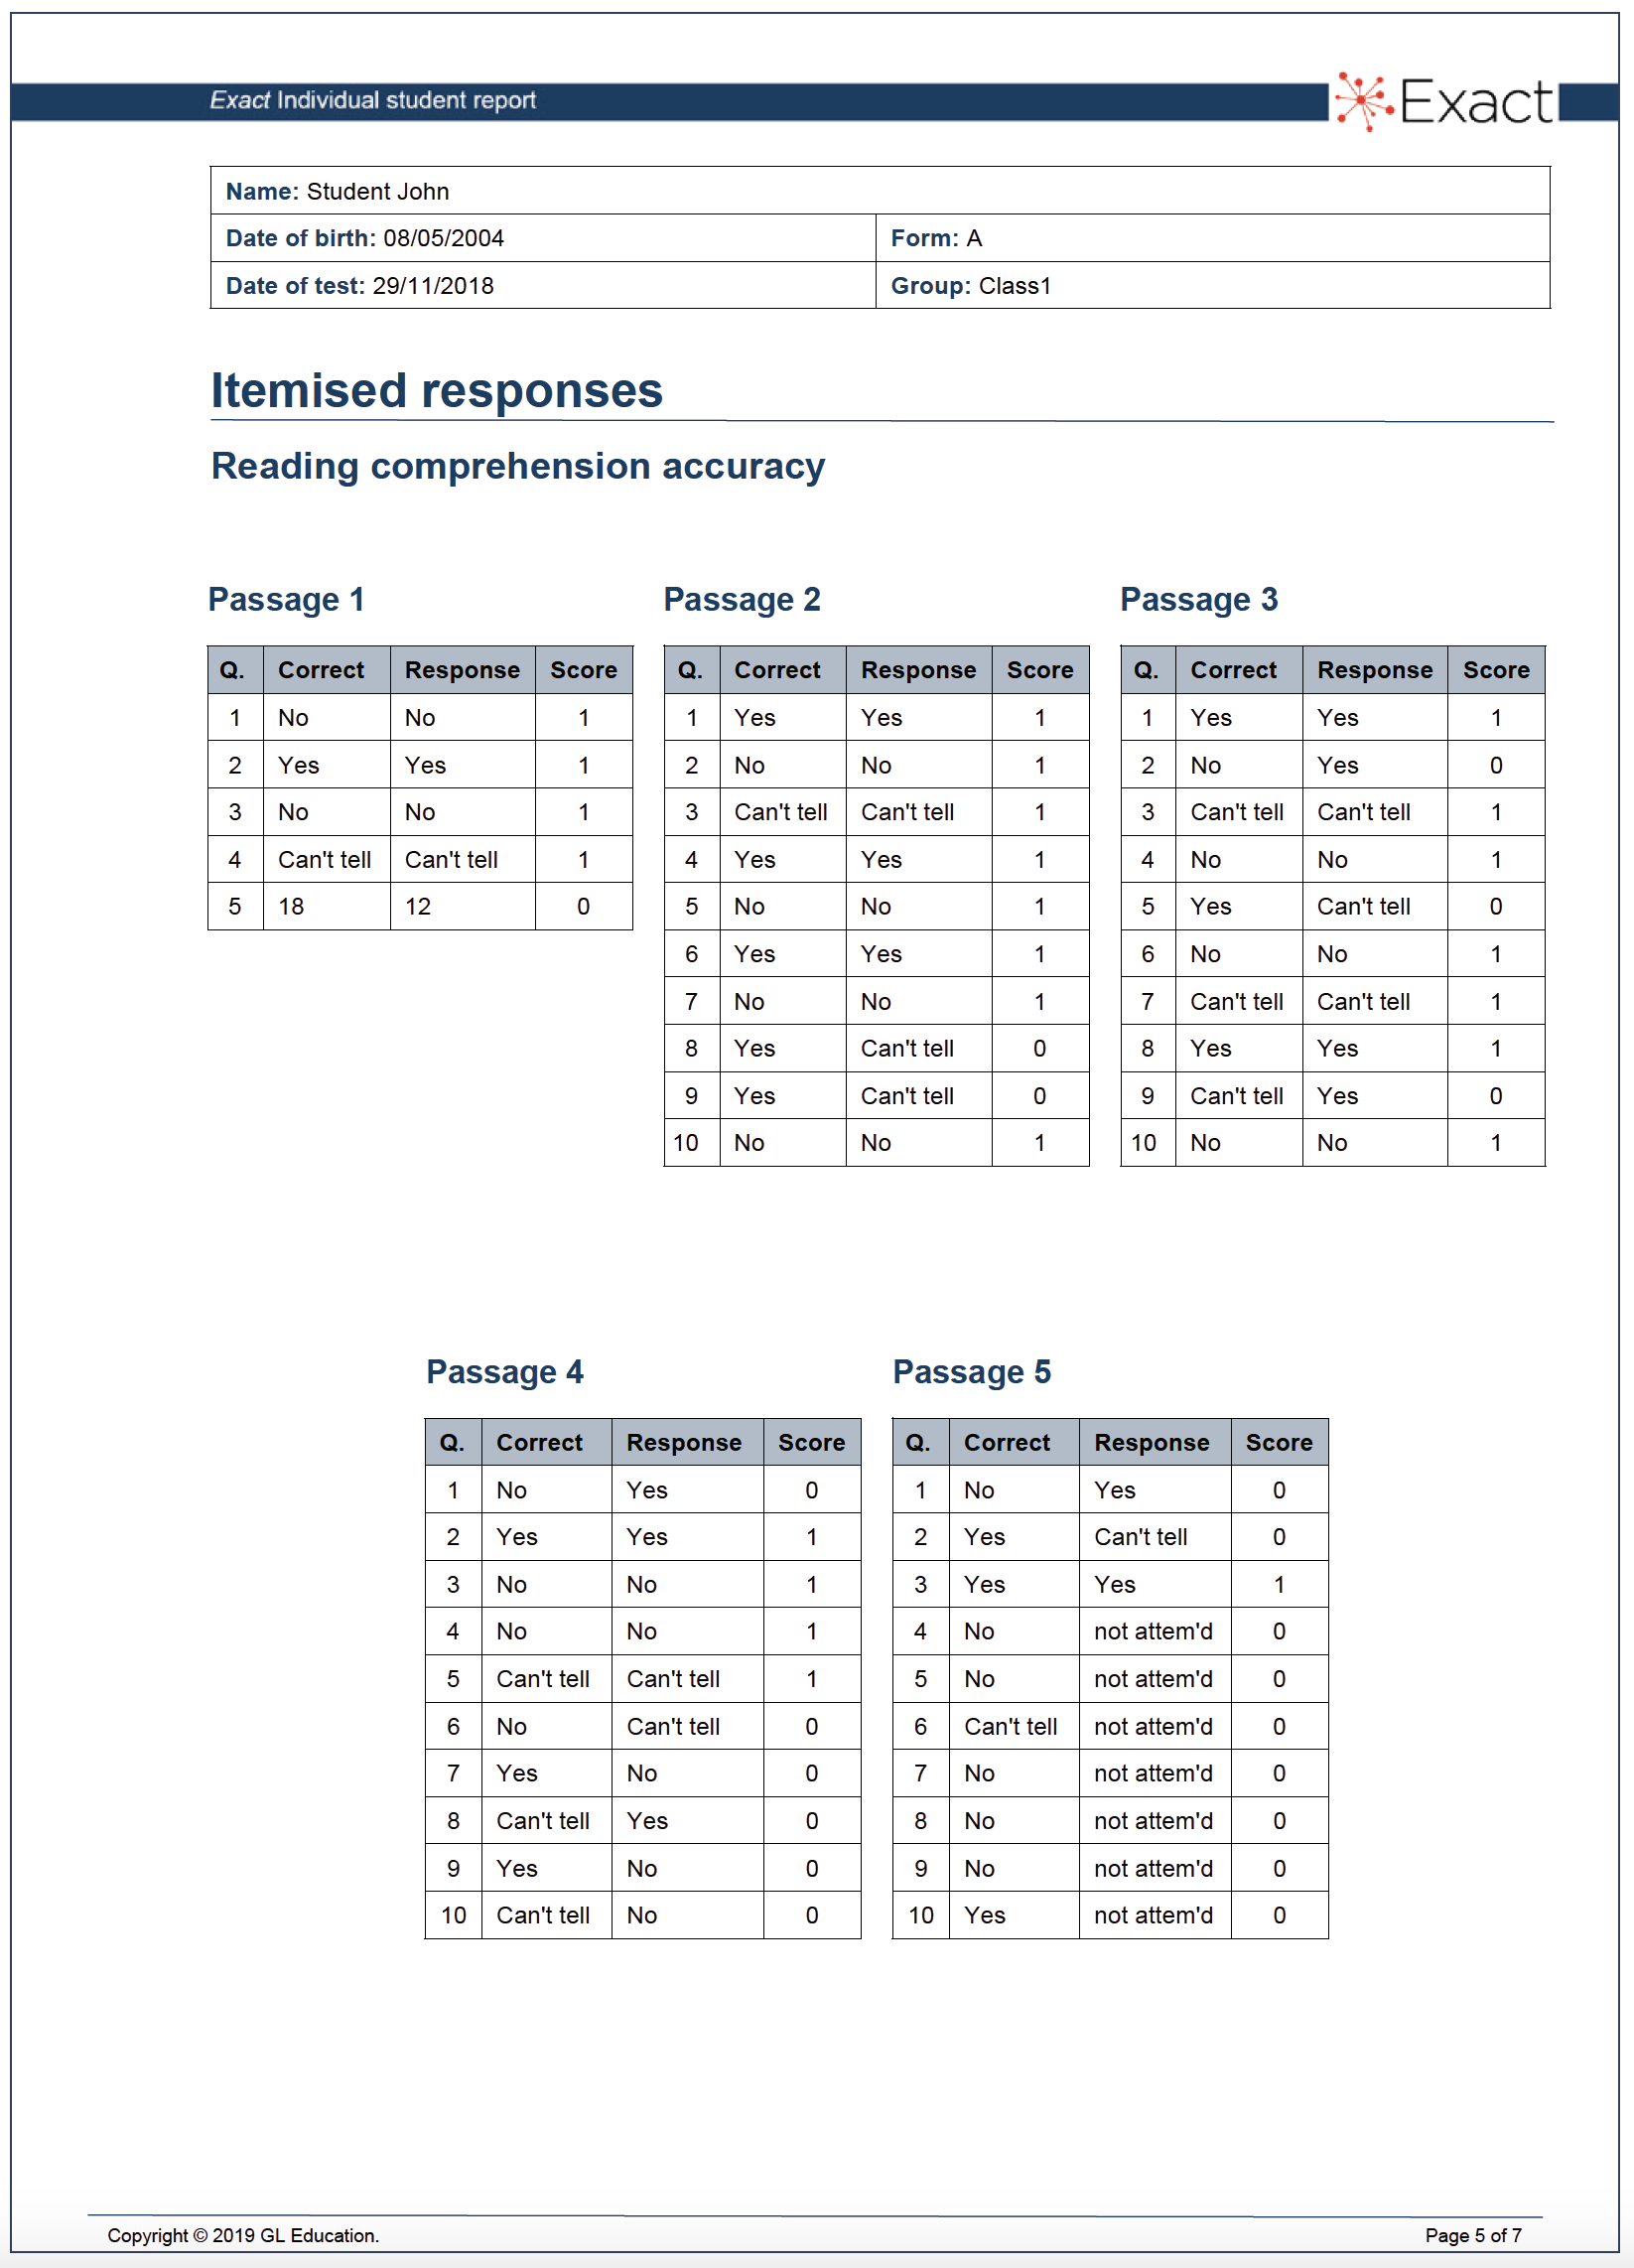
Figure 3. Example of itemised responses
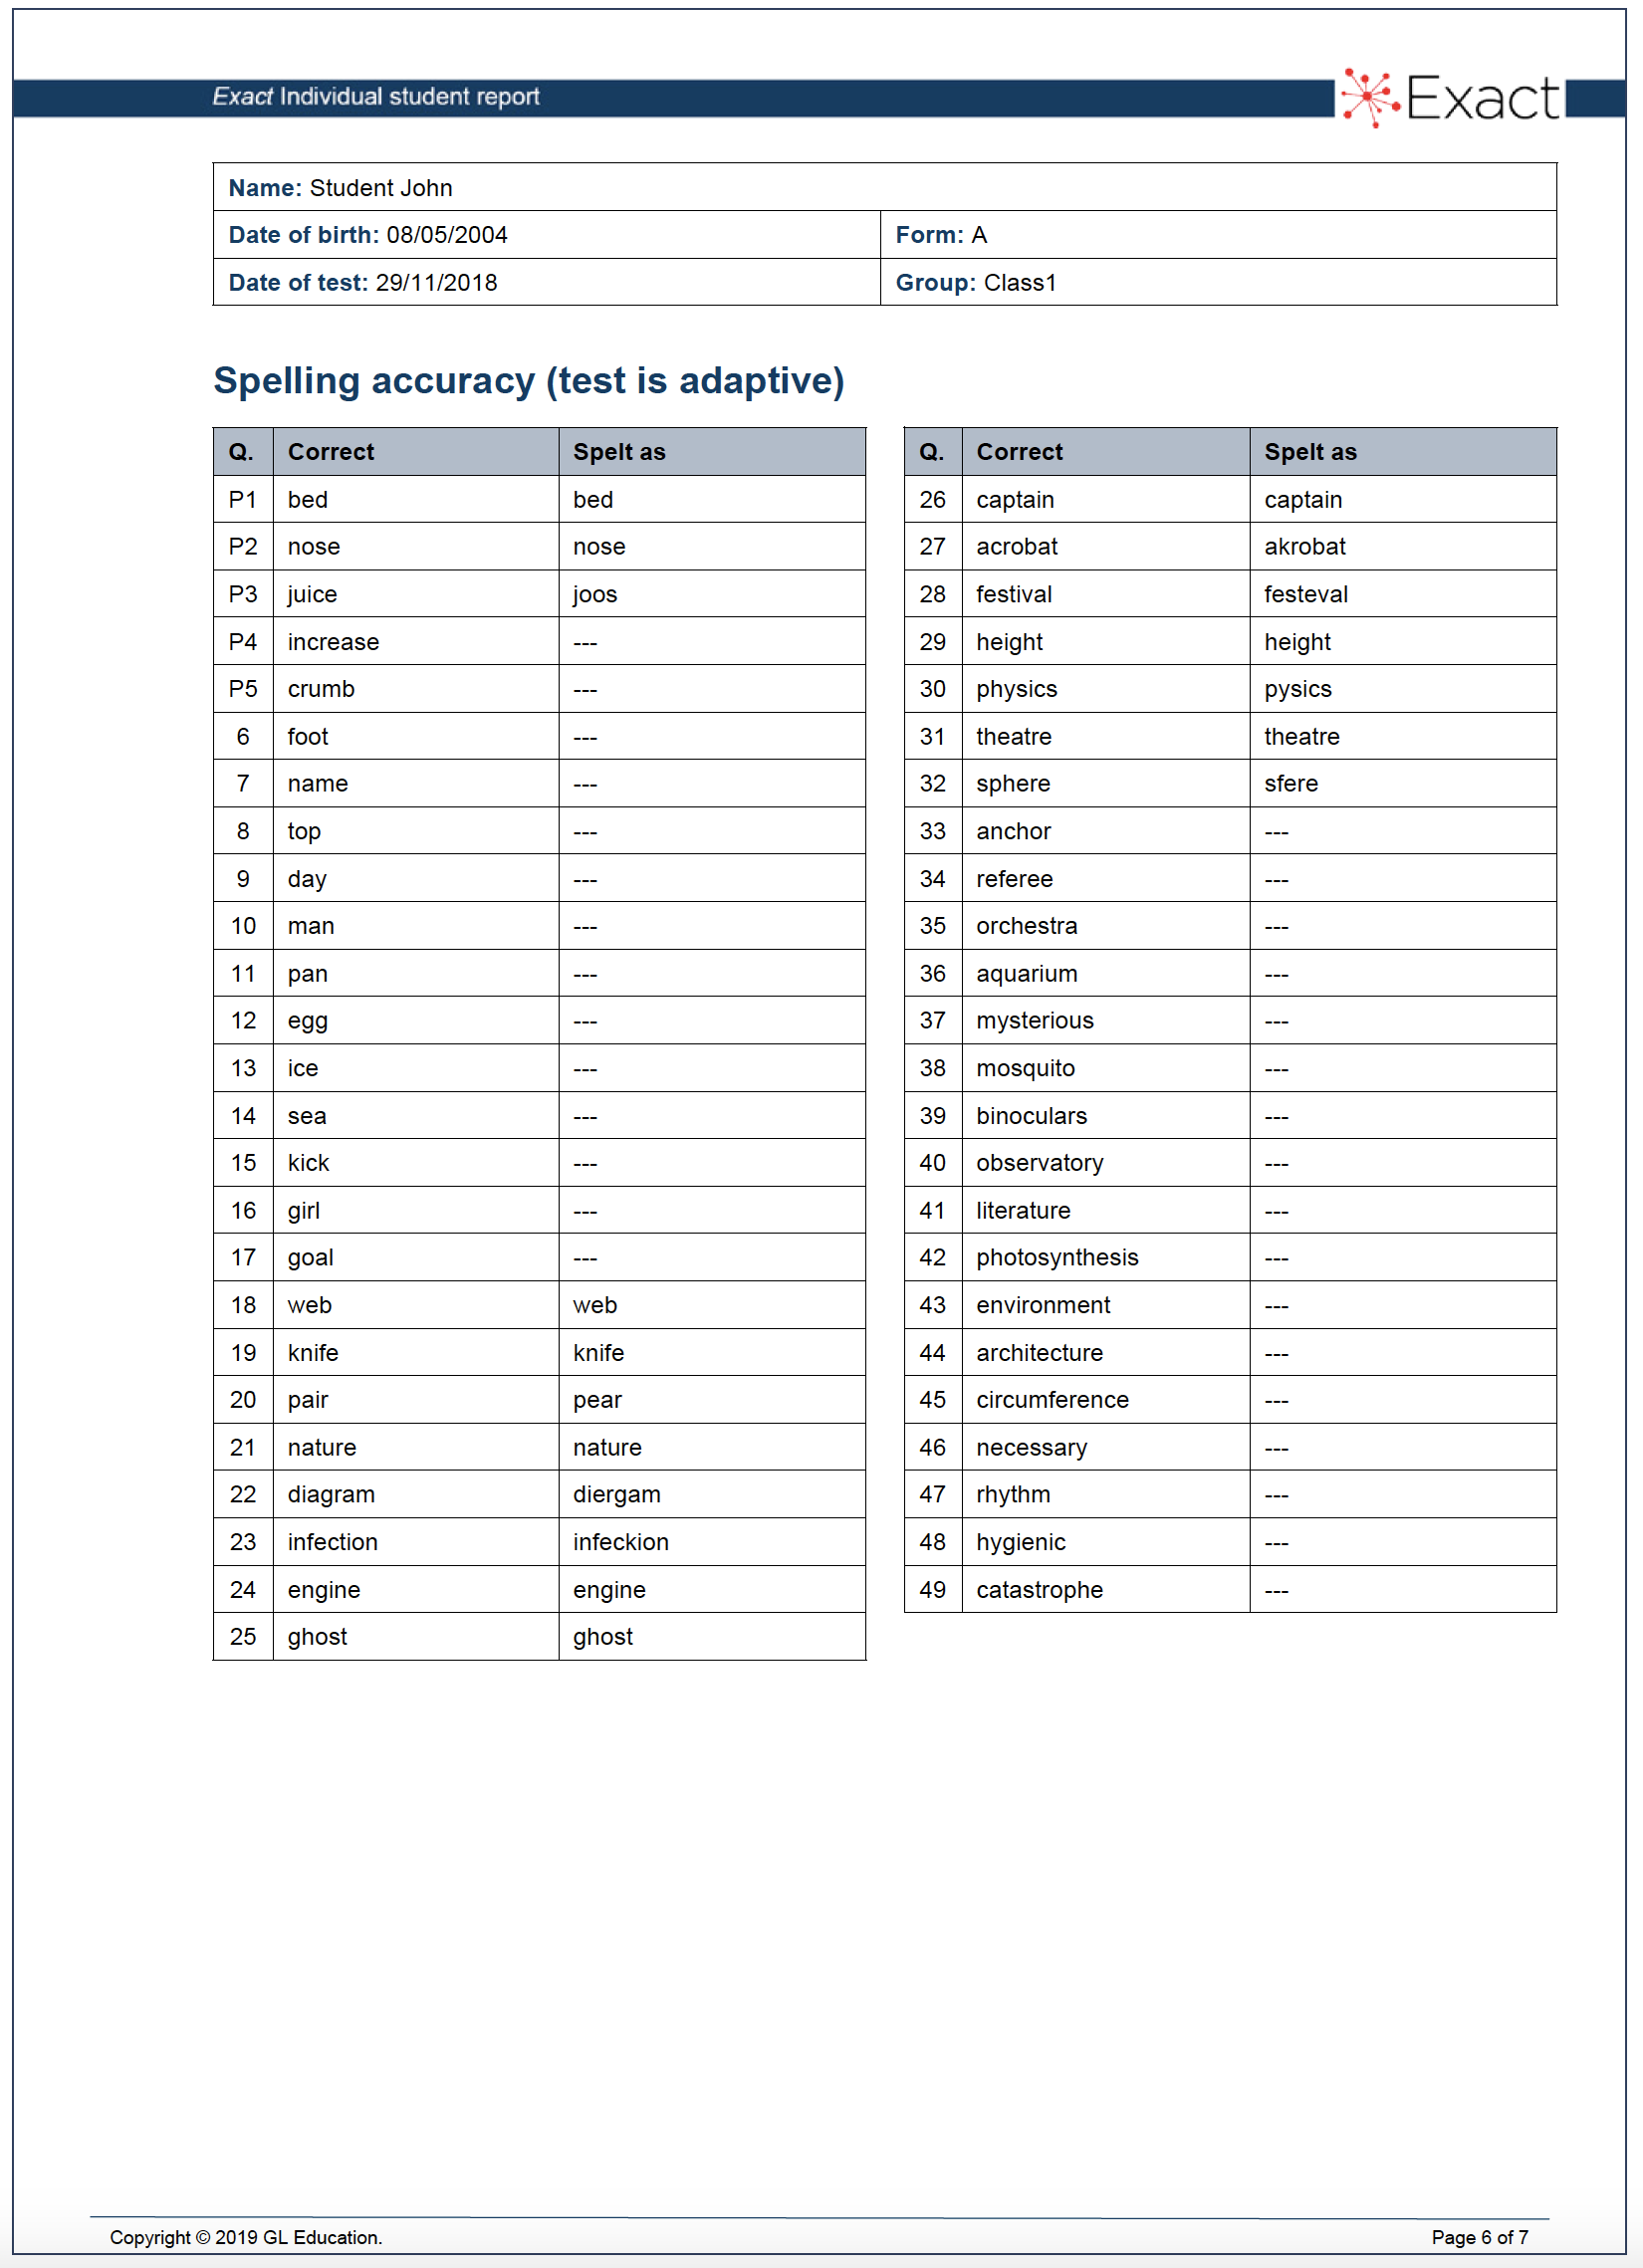

Figure 4. Example of handwriting to dictation
Standard scores
Standard scores are provided in 3-month age bands from 11:0 to 18:11 and in 12-month age bands from 19:0 to 24:11. Standard scores have a mean (average) of 100 and a standard deviation of 15. 15 They are distributed in a normal (bell-shaped) curve as shown in Figure 5. Distribution of Exact scores on a normal curve. Approximately two-thirds of the population will have scores that fall between plus or minus one standard deviation of the mean (i.e. score range 85–115, which is the area shaded blue on the graph in Figure 5. Distribution of Exact scores on a normal curve. In some scoring systems the range 85–115 is regarded as the ‘average range’, while other systems treat 90–110 as the ‘average range’; in the latter case, 50% of the population will fall into the average band. The more extreme the score the fewer individuals are found in that category, so that only about 2% of the population have very low scores (less than 70) and about 2% have very high scores (130+). This distribution of scores is a characteristic of all human attributes (height, weight, strength, sociability, etc.), i.e. most people tend to cluster around a central point, and as one approaches the extremes (known as the ‘tails’ of the distribution) fewer people are found.
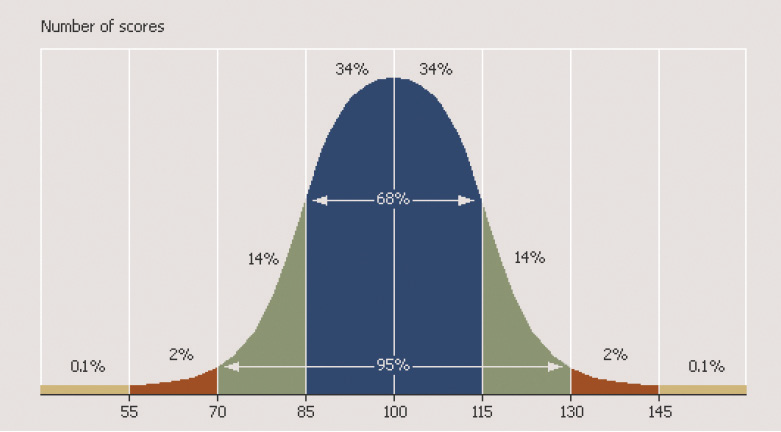
Figure 5. Distribution of Exact scores on a normal curve
15 The standard deviation is a measure of the variation of scores in a distribution.
Confidence intervals
When reporting a standard score, it is good practice also to report the confidence interval attached to that score. The reason for this is that all psychological and educational test scores give only estimates of ability, based on a sample of behaviour at a given point in time. If you were to assess a student on several occasions you would not expect him or her to obtain exactly the same score each time – there would be a spread of scores, and somewhere within that spread we would expect the (hypothetical) true score to lie. The amount of spread or variation of actual scores obtained by an individual is dependent on the reliability of the test. The confidence interval is the zone around the standard score in which we are reasonably confident the true score lies. Different confidence intervals may be set; for Exact we have set a confidence level of 90%, which means that there is a 90% probability that the true standard score lies within the stated confidence interval. Put another way, if the student was retested 100 times, on 90 out of 100 occasions the score would lie within the stated confidence interval.
Confidence intervals are calculated on the basis of the ‘Standard Error of Measurement’ (SEM) of a test which, in turn, is determined by the reliability of the test and the standard deviation of test scores (see Section 1.6). Confidence intervals are shown in the Results breakdown section of the Exact report.
Percentile scores
Percentile scores are provided in 3-month age bands from 11:0 to 18:11 and in 12-month age bands from 19:0 to 24:11. Percentile scores (sometimes referred to as ‘centile’ scores) represent the student’s performance in comparison with the population norms in percentile units, which range (roughly) from 1 to 99. A percentile score of 63, for example, means that the student’s score lay at the point where 63% of the population scored less, and 37% scored more. A percentile score of 50 indicates that the student’s score lay exactly on the median (middle point) of the distribution, with half the age group scoring higher and half lower. As will be obvious from Figure 5, percentile scores have a strict relationship with standard scores, as shown in Table 5. Relationship between standard scores and percentile scores.
Table 5. Relationship between standard scores and percentile scores

Age equivalents
Age equivalents are provided for the age range 6:0 to 18:11 (over this age, age equivalents become meaningless). Age equivalents may be defined as the average chronological age of students who would be expected to achieve a given raw score on the test. The most common type of age equivalent in educational testing is the ‘reading age’. For example, to say that a student has a reading age of 14 means that they read like an average 14-year-old, regardless of their chronological age. Note that age equivalents, by their very nature, are not as precise as standard scores or percentile scores; age equivalents are approximations and hence are often given in bands. Age equivalents should be used with caution and only in cases where standard scores or percentile scores would be inappropriate or unhelpful. It is embarrassing and demotivating for a teenager or adult to be told (for example) that they have a spelling age of a 7-year-old! However, some teachers working in special education prefer to use age equivalents rather than percentile scores, because age equivalents enable them to conceptualise the ability level of the student they are teaching, and so pitch the work at the correct level.