
Value-Added Service
“Value-Added dashboards really showed the good work we do and have given us greater confidence in our Value-Added message as a school.”Chris McIvor, Head of Key Stage 3, Campbell College Belfast
The GL Education Value-Added Service provides a quantifiable measure of the impact your school’s teaching has had on its students. The service provides evidence that gives a richer understanding of a school’s performance considering the starting point of each student using CAT4 as the baseline measure.
The information is delivered via an easy to use dynamic dashboard that allows you to carry out detailed analysis into the performance of groups, subjects, cohorts and individual students. Not only that but you can also compare your results against the average of other schools using the service.
"The new value-added service offered by GL Education in conjunction with FFT is a great step forward in helping international schools analyse their progress data against CAT4 potential in an interactive and visual way."Mark Shahparaki, Deputy Headmaster, Rashid School for Boys, Dubai, UAE
How can you use the information?
- Measure the impact of teaching and learning on students’ actual attainment scores
- Pinpoint academic performance strengths and weaknesses
- Inform development plans, inspections and accreditations
- Demonstrate school performance to parents and other stakeholders
School summary dashboard
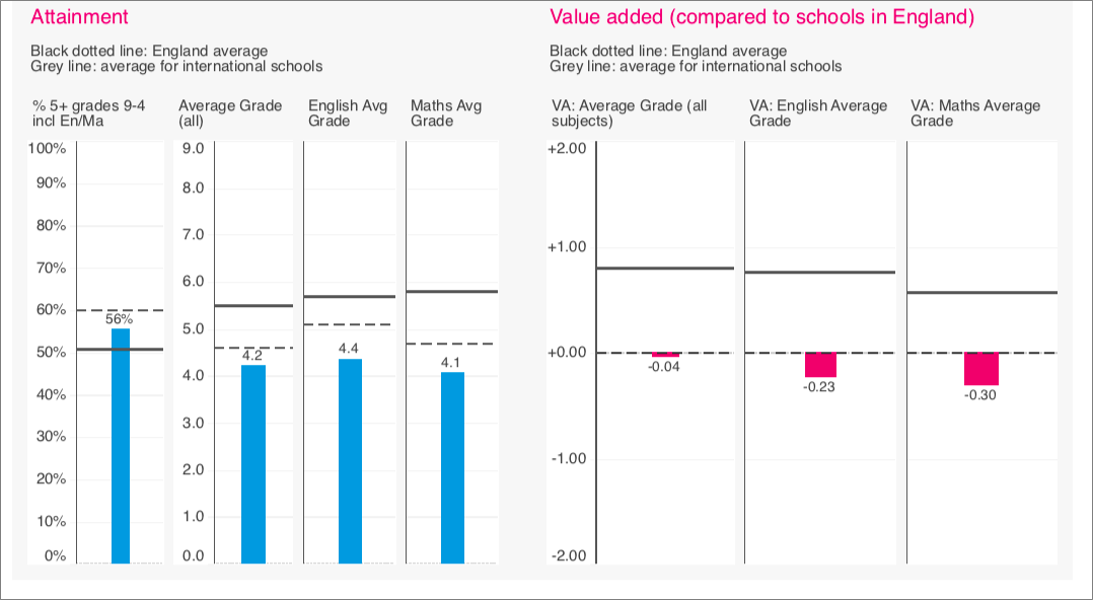
An overview of your school’s attainment and value-added in comparison to the UK and International schools using the service
Student group dashboards
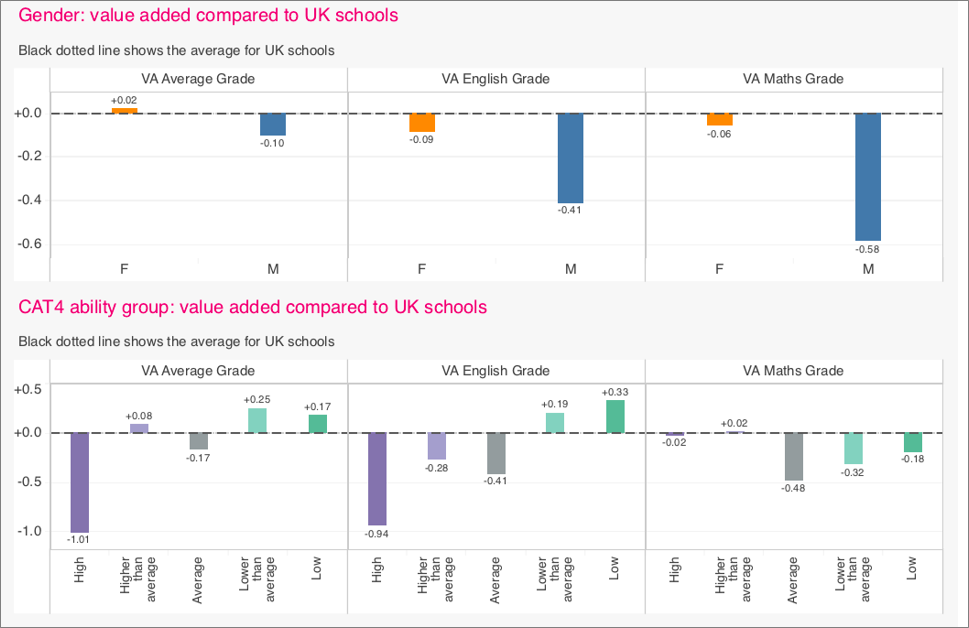
Compare and analyse performance of CAT4 ability groups and CAT4 verbal ability groups in order to determine where your school is making the greatest impact and where there may be room for improvement.
Scatterplots
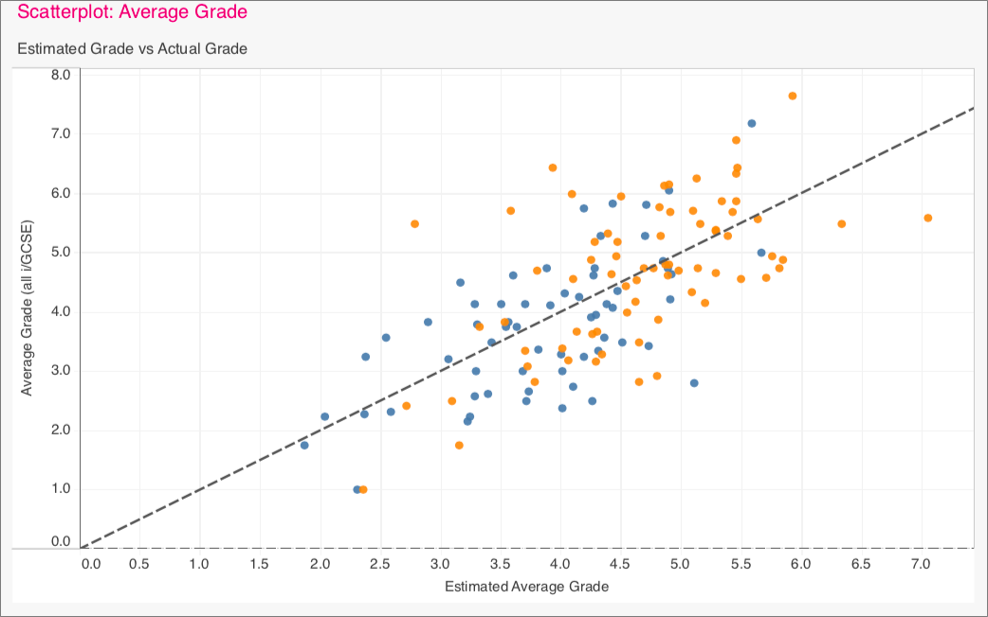
Visualise and evaluate student performance. Compare CAT4 mean SAS and VA average grade and estimated average grade with average grade.
Subject dashboards
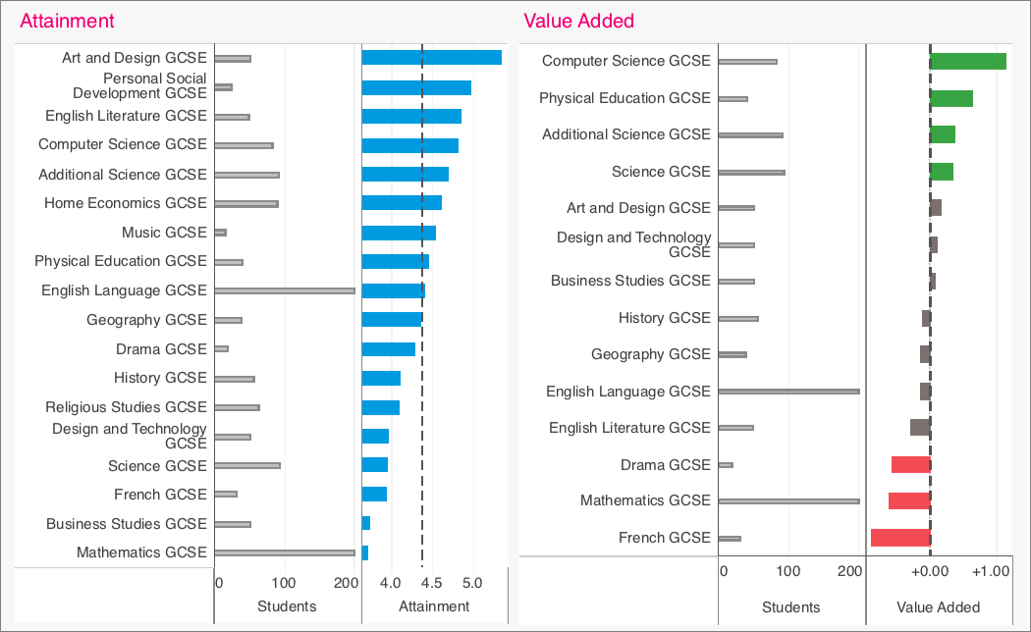
Provides insight and allows you to analyse and compare subject attainment and value-added for your school.
How does it work?
The GL Education Value-Added Service uses several data inputs including overall CAT4 score (mean SAS), CAT4 scores in each of the four batteries (verbal, non-verbal, quantitative and spatial), gender and month of birth. These inputs are used together to create an indicator for each student, which can be compared to actual exam performance to create a value-added score for each student, subject and overall school performance. The increased accuracy means a more powerful analysis in which schools can really see where they are making the most impact and for which types of students and in which subjects.
A school can look at attainment and exam results, to see how well they are doing, but value-added takes account of expected and actual attainment data where each student started from and the progress they made relative to other, similar students. The value-added allows you to monitor trends over time by looking at year on year comparisons. This information across the whole school will help school leaders in driving improvements.
Frequently asked Questions
What is the Value Added service?
- The Value-Added Service provides a measure that compares a cohort’s CAT4 results with their exam results to show what value a school has added. The CAT4 result represents a student’s reasoning abilities and the exam results represent what they have achieved with the combination of their reasoning abilities and the school’s teaching.
Which types of school are eligible for the service?
- The service is currently available to our CAT4 customers in UK independent senior schools and in post primary schools in Northern Ireland, although students must complete GCSEs, IGCSEs, International Baccalaureate Diploma and/or A levels.
- The service is also available to all international schools where students take iGCSEs, International Baccalaureate Diploma and/or A levels.
What data must we have?
- The service requires schools’ students to have completed CAT4 prior to them starting the examinations year (i.e. for most, any time before the start of Year 11).
Why use this service?
The Value-Added dashboards enable schools to:
- Measure the impact of teaching and learning on students’ actual attainment scores.
- Demonstrate school performance to parents and other stakeholders.
- Pinpoint academic performance strengths and weaknesses.
- Inform development plans and inspection self-evaluation forms.
How do we access our dashboards?
- Upon completion of the dashboards, schools will receive emails containing a link to the dashboards and login details.
Who do we contact for support?
Queries relating to the Value Added Service should be emailed to [email protected].
Can we provide historical data for the purposes of accessing trend reports?
- Yes! There are great benefits to long-term trend reports. Your school can add examinations data for as far back as 2018 if you also have CAT4 data for sufficient numbers of students within the relevant cohorts.
About the Fischer Family Trust (FFT)
GL Education and The Fischer Family Trust (FFT) are working together to provide the Value-Added service. The FFT is a not-for-profit organisation specialising in the analysis of school performance data and providing value-added analysis to over 15,000 schools in the UK and internationally.
Get in touch
If you have any questions about the Value-Added Service please email [email protected]